BLOG
Peak performance: Q4 2018 e-commerce statistics [Infographic]
Published: Jan 10, 2019

Expectations for e-commerce going into Q4 were mixed to say the least. See how it all turned out with these Q4 2018 e-commerce statistics.
The outlook for retail and e-commerce heading into Q4 2019 was cautious, with November the ‘worst on record’ for UK retailers, and similar ‘warning signs’ in the US.
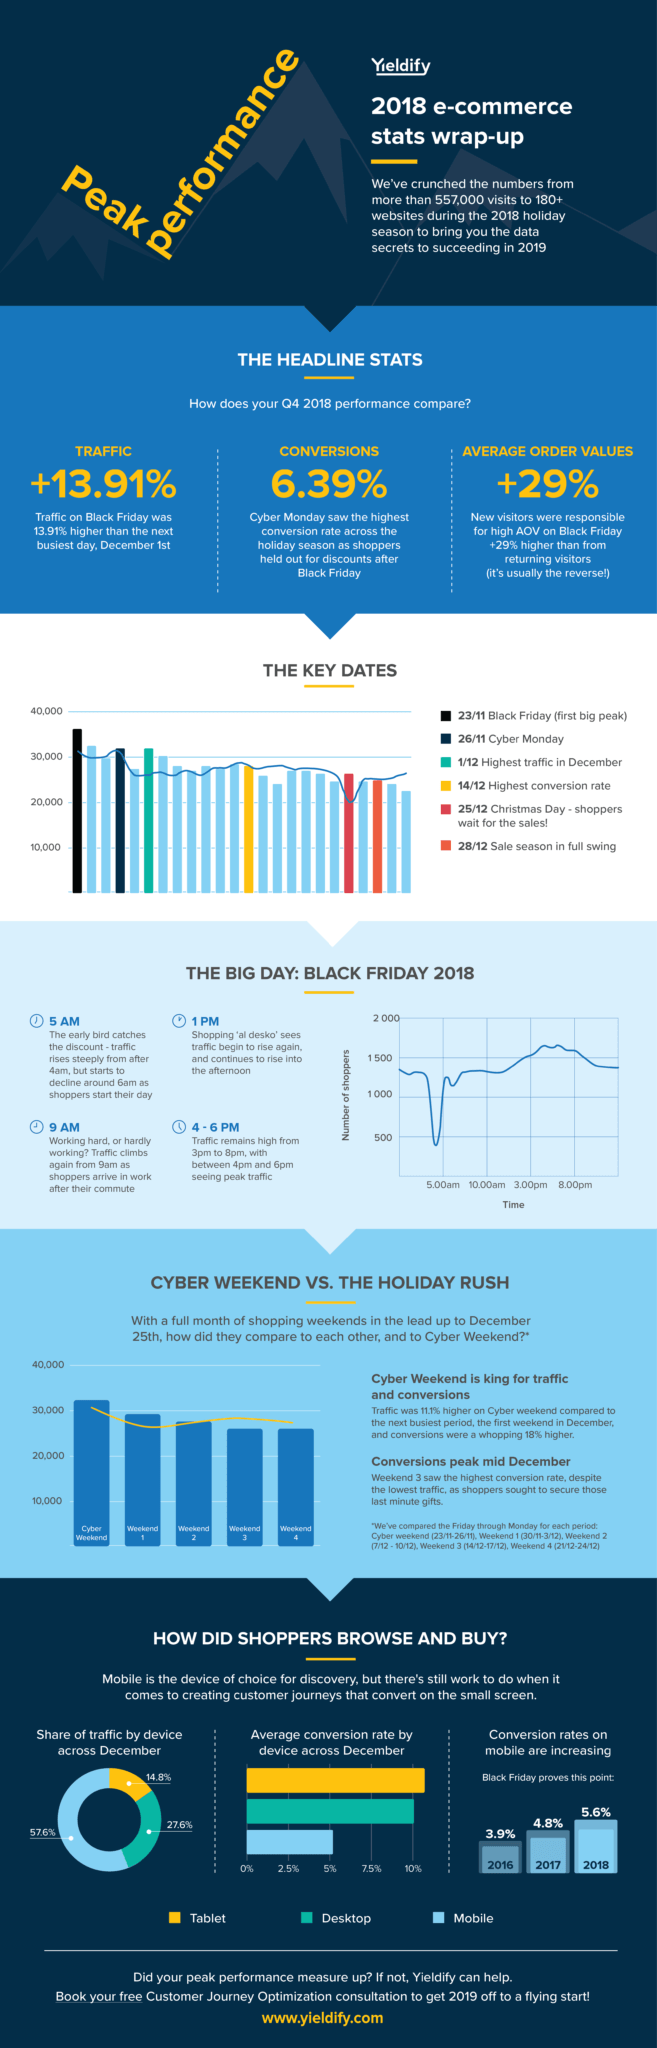
Now it’s 2019 we decided to take a look back at the data to understand what happened during key shopping periods like Black Friday and the holiday season, and what e-commerce brands should know when it comes to traffic, conversions and more.
We analyzed over half a million visits across November and December to US and UK websites to understand consumers to understand peak performance. Here are a few of the key insights from our Q4 2018 e-commerce statistics:
- It started early, with Black Friday driving the most traffic
- December traffic peaked on the 1st, conversions peaked later
- Mobile is the device of choice for discovery, and conversion rates are slowly growing
View the infographic below to see all the data and insights!
Did your peak performance measure up? If not, we’re on hand to help. Book a free Customer Journey Optimization consultation. Get more leads and ideas to get your 2019 off to a flying start!